SetName »
The SetName Node is used to enter the data for each experimental set. Here you may add, delete, and include Data Points. When there are many data points, it may be easier to add multiple data points through the Add Data Point action, and then copy the values from a spreadsheet into the cells in the grid.
This node has one Total Moles (or Total Mass) tab, plus a tab for each Phase defined in the project. For CSTR reactors, additional tabs related to intermediate feed or separation may also be enabled. By default, this node shows the experimental data for one set. If the sets are merged, then this node shows the experimental data for all sets in a single node.
Tabbed ViewsThis node has one Total Moles (or Total Mass) tab, plus a tab for each Phase defined in the project. For CSTR reactors, additional tabs related to intermediate feed or separation may also be enabled. By default, this node shows the experimental data for one set. If the sets are merged, then this node shows the experimental data for all sets in a single node.
Actions
Tabbed Views
Total Moles
Total Mass
Phase
Description
Intermediate Feed
Intermediate Separation
Total Moles
The Experimental Data grid is used to add the experimental data for the set, and is organized as follows:
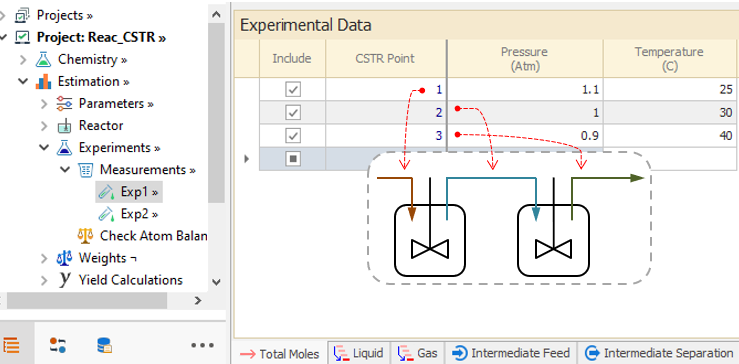
When you open the Description pane, a picture is shown to facilitate the loading of experimental data for a given CSTR configuration. For example, the following schematic corresponds to a CSTR series with Intermediate Feed and Separation enabled:
Data Organization for PFR reactors: If you select PFR reactor, at least two data points (inflow and outflow) must be entered in each experimental data set. The first data point contains the information of the PFR's inflow, and the following data points correspond to the points along the length of the PFR.
The experimental data should follow the rules below:
Adding a Data Point
When a new set is added in the Experiments node, it automatically contains two Data Points. You may add Data Points directly or through the Add Data Point action.
Deleting a Data Point
You may delete a Data Point by selecting the Data Point row and using the <DELETE> key. A message box will appear asking if you are sure to delete the Data Point. Click OK.
Note: You may run Checkmodel to verify that the experimental data have been entered correctly.
Top of Topic The Experimental Data grid is used to add the experimental data for the set, and is organized as follows:
- Include: You may include a Data Point by clicking in the corresponding check box. By default, each new Data Point is included. If a data point is not included, it will not be considered in the Estimation Model.
- Data Point (For Batch and PFR Reactors): This column is used to add and delete the Data Points, which are the identifiers for each measurement in the set. The Data Point should be entered first before any other data for the row is entered. Data Points must be integers, should start from 1, and should be in ascending order. Once a data point is entered, you cannot rename it. If the sets are merged in this node, the datapoint column becomes a read-only column.
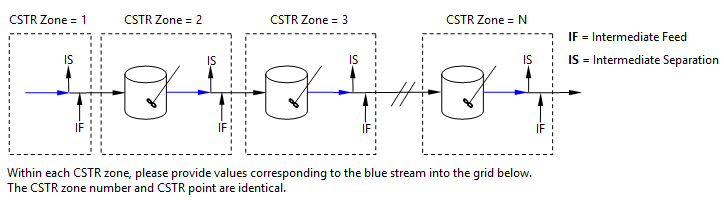
- CSTR Point (For n-CSTR Reactors): This column is used to add and delete the CSTR reactors in series. The row corresponding to each CSTR Number holds information pertaining to the entry point to that CSTR. The CSTR Point should be entered first before any other data for the row is entered. CSTR Points must be integers, should start from 1, and should be in ascending order.
- Measured Variable(s): The sequence of variables that have been selected in Measurements - Total Moles Column are displayed in columns along with their units. You may enter the experimental data here, which should be in the advised units.
|
|---|
When you open the Description pane, a picture is shown to facilitate the loading of experimental data for a given CSTR configuration. For example, the following schematic corresponds to a CSTR series with Intermediate Feed and Separation enabled:
|
|---|
Data Organization for PFR reactors: If you select PFR reactor, at least two data points (inflow and outflow) must be entered in each experimental data set. The first data point contains the information of the PFR's inflow, and the following data points correspond to the points along the length of the PFR.
The experimental data should follow the rules below:
- The initial condition for both batch and PFR reactors must be unique. Therefore, there must be one and only one included data point for which time (in case of batch reactor) or volume/catalyst mass (in case of PFR reactor) is zero. However, replicates for non-initial conditions are allowed, more than one data point can be entered for the same time in a batch reactor, or for a given volume/catalyst mass in a PFR reactor.
- If the reactor type is Batch:
- If you select Volume as Interpolated from Data in Volume Property value, no included Volume data point can be zero. If you select Volume as Constant, only the first included Volume data point must be non-zero.
- If the phase behavior is MultiPhase, the Time value for the last included data point in each phase sub-node must be equal to the Time value for the last included data point in Total Moles Node.
- If you select Catalyst Mass as Rate Basis, the first data point in the Catalyst Mass must be greater than zero.This value is used through all the Batch Horizon.
- If the reactor type is n-CSTR:
- If you select Volume as Rate Basis, the first data point in the Volume value must be zero. Note that the first data point is the entry to the first CSTR.
- If you select Catalyst Mass as Rate Basis, the first data point in the Catalyst Mass must be zero.
- If the reactor type is PFR:
- If you select Flow as Interpolated from Data in Flow Property value no included Flow data point can be zero. If you select Flow as Constant, only the first included Flow data point must be non-zero.
Adding a Data Point
When a new set is added in the Experiments node, it automatically contains two Data Points. You may add Data Points directly or through the Add Data Point action.
- Directly: ( Not available when sets are merged ) You may add a new Data Point by going to the last row and entering the name of the desired Data Point (remember that it must be a integer number). The row will change to edit mode, and you can save this new Data Point with the <ENTER> key or by clicking on the pencil icon in the row header. This Data Point will now be part of the Set.
Deleting a Data Point
You may delete a Data Point by selecting the Data Point row and using the <DELETE> key. A message box will appear asking if you are sure to delete the Data Point. Click OK.
Note: You may run Checkmodel to verify that the experimental data have been entered correctly.
Total Mass
The tab is shown when Mass Density is selected as units of concentrations in Units Configuration node, and behaves exactly same to the Total Moles tab.
Top of Topic The tab is shown when Mass Density is selected as units of concentrations in Units Configuration node, and behaves exactly same to the Total Moles tab.
Phase
The Phase tab is used to enter all the variables that have been selected as measured in each phase in the Measurements node. These tabs are organized almost identically to the Total Moles tab.
Top of Topic The Phase tab is used to enter all the variables that have been selected as measured in each phase in the Measurements node. These tabs are organized almost identically to the Total Moles tab.
Description
This pane is available only for CSTR reactors, and is just a pictorial aid. The main purpose here is to graphically relate streams in the CSTR series with the CSTR Points in the grids, where the information is to be provided.
The appropriate streams are dynamically highlighted as you activate the different tabs in this node.
Top of Topic
Intermediate Feed
This tab only appears for CSTR reactors with Intermediate Feed enabled in the Reactor node.
All compounds are listed in columns, and you may specify the amount of intermediate feed added at each CSTR point. When Use Energy Balance is enabled in the Reactor node, the Temperature column appears for each intermediate feed stream.
You may activate the Description pane to ensure that the data is specified for the correct streams.
Top of Topic
Intermediate Separation
This tab only appears for CSTR reactors with Intermediate Separation enabled in the Reactor node.
The layout here depends on the selected separation option. For Overall Based separation, all compounds are listed in columns so you can enter the percentage removal for each compound at the CSTR point. For Phase Based separation, all phases are displayed, so you may specify the percentage removal of each phase.
Top of Topic
Actions
Add DataPoint
Sort Data
Remove Gaps
Quick Run
Open Solver
Add DataPoint
This action is used to add data points. By executing the Add Data Point action, a parameters dialog appears asking you for the number of Data Points to be added. Enter this information and click Ok to generate the datapoints for this set. This action is also available on the Node Menu, as shown in the green highlighted area in the figure below.
Sort Data
When Sort Data is executed, the data points are reorganized in ascending order of the discretized variable. This sort also ensures that datapoint consistency is maintained throughout the project.
After Sort Data is executed, all the data from the Results tree is deleted and you need to run the project again.
Remove Gaps
When Remove Gaps is executed, gaps in the datapoint sequence are eliminated. For example, if you have consecutive datapoints 8,10,11 and 12, the points 10, 11 and 12 are renumbered as 9, 10, and 11 respectively. Again, the gap removal is done systematically throughout the project, thus ensuring that datapoint consistency is maintained.
After Remove Gaps is executed, all the data from the Results tree is deleted and you need to run the project again.
Top of Topic
See Also: